Welcome to sysLoss#
sysLoss is a tool for analyzing system power and losses. From the smallest IoT sensor to large industrial installations. The tool is efficient and easy to use, the analysis result provides a detailed report on voltages, currents, power and efficiency for every component defined in the system. Output format is Pandas DataFrame: Create charts, plots and export to Excel and other formats.
Installation#
To get started with sysLoss, install the python package from PyPI with:
$ pip install sysloss
Upgrade to the latest release with:
$ pip install --upgrade sysloss
Or install with conda:
$ conda install conda-forge::sysloss
First system model#
A simple, battery-powered Bluetooth sensor can be defined as simple as this:
from sysloss.components import *
from sysloss.system import System
bts = System("Bluetooth sensor", Source("CR2032", vo=3.0, rs=10))
bts.add_comp("CR2032", comp=Converter("Buck 1.8V", vo=1.8, eff=0.87))
bts.add_comp("Buck 1.8V", comp=PLoad("MCU", pwr=13e-3))
bts.add_comp("CR2032", comp=Converter("Boost 5V", vo=5.0, eff=0.82))
bts.add_comp("Boost 5V", comp=RLoss("RC filter", rs=6.8))
bts.add_comp("RC filter", comp=ILoad("Sensor", ii=6e-3))
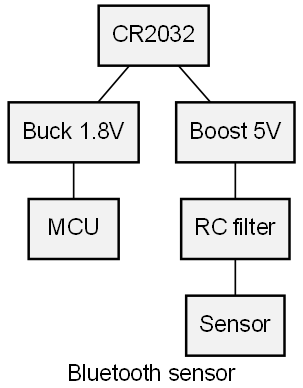
bts.tree()
Bluetooth sensor
└── CR2032
    ├── Boost 5V
    │   └── RC filter
    │       └── Sensor
    └── Buck 1.8V
        └── MCU
bts.solve()
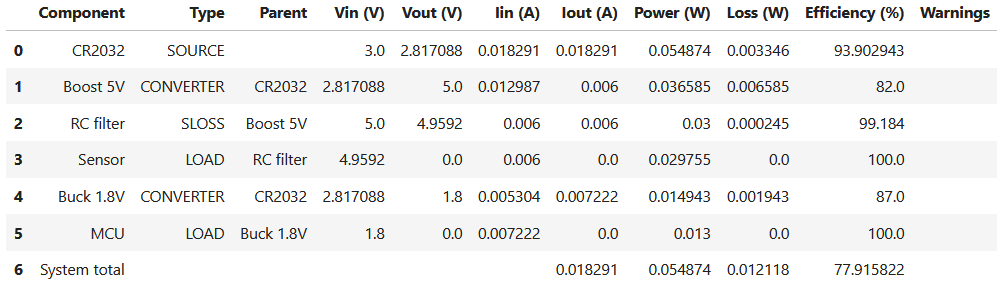
Diagrams#
sysLoss can also produce graphical power tree diagrams:
import sysloss.diagram as sd

sd.make_diag(bts, fname="bts.png")
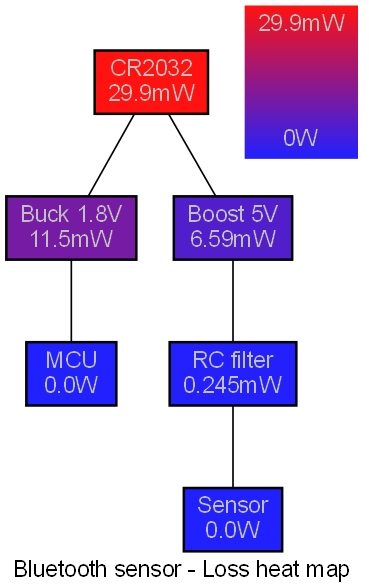
And heat diagrams:
sd.make_hdiag(bts, fname="bts-heat.png")
Next step#
The best way to learn sysLoss is to explore the tutorials section. The tutorials are Jupyter Notebooks that can also be found in the GitHub repository under docs/nb.